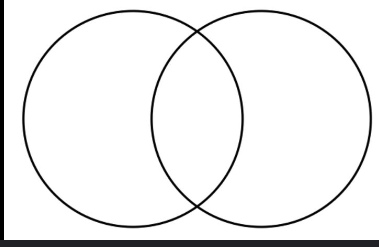
वेन आरेख: तर्कों की वैधता स्थापित करने के लिए सरल और बहुउपयोगी (Venn diagram: Simple and multiple use for establishing validity of arguments )
वेन आरेख सेटों और उनके बीच संबंधों का ग्राफिकल प्रतिनिधित्व हैं। उनमें ओवरलैपिंग सर्कल शामिल हैं जो विभिन्न सेटों का प्रतिनिधित्व करते हैं, और ओवरलैप उन तत्वों को दर्शाता है जो उन सेटों के लिए सामान्य हैं। वेन आरेख जानकारी को दृश्य रूप से व्यवस्थित करने के लिए उपयोगी उपकरण हैं और तर्कों की वैधता स्थापित करने के लिए विभिन्न तरीकों से इसका उपयोग किया जा सकता है।
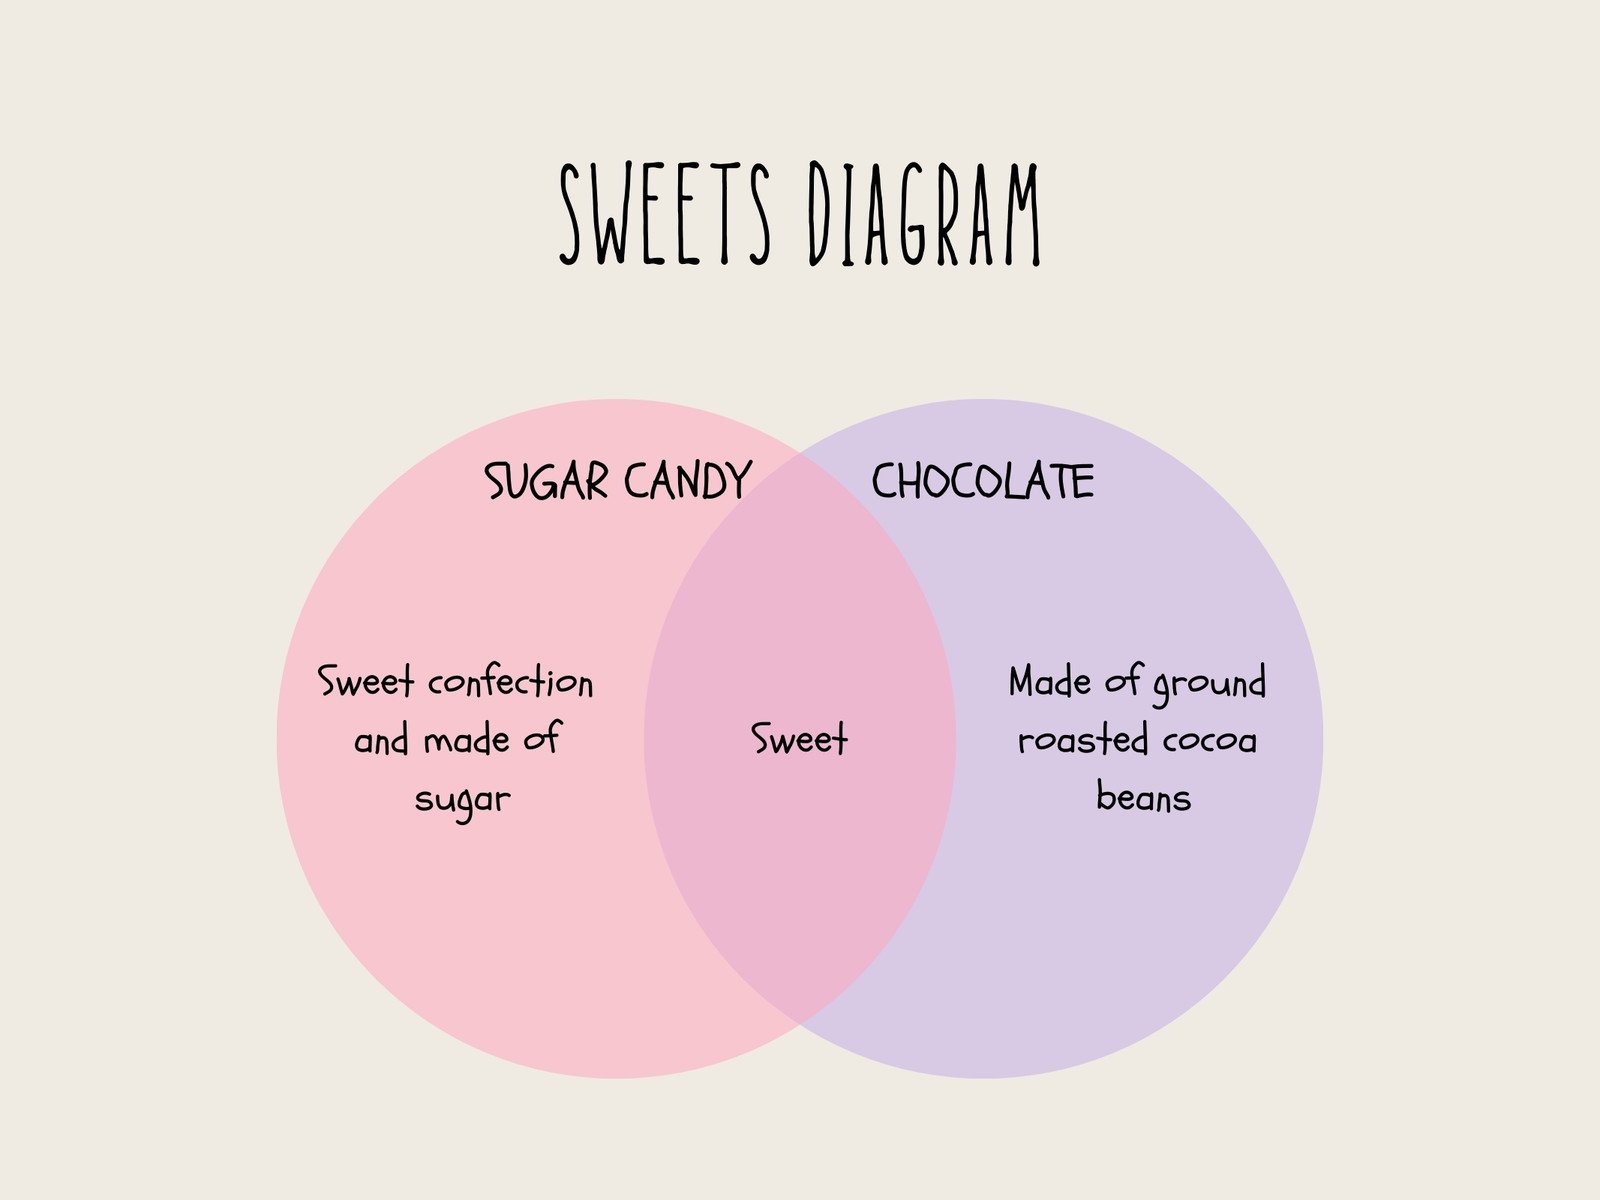
Image Source: Canva
Symbolic Representation of Venn Diagram
वैधता स्थापित करने के लिए सरल उपयोग:
1. श्रेणीबद्ध न्यायवाक्य:
– वेन आरेखों का उपयोग अक्सर श्रेणीबद्ध न्यायशास्त्र की वैधता का आकलन करने के लिए किया जाता है। प्रत्येक वृत्त एक श्रेणी का प्रतिनिधित्व करता है, और ओवरलैप सामान्य तत्वों का प्रतिनिधित्व करता है।
– उदाहरण:
– सभी मनुष्य नश्वर हैं। (“मनुष्यों” के लिए एक वृत्त के अंदर “नश्वर” के लिए एक वृत्त द्वारा दर्शाया गया है।)
– सुकरात एक इंसान हैं. (“मानव” सर्कल के साथ ओवरलैपिंग।)
– इसलिए, सुकरात नश्वर है। (यह निष्कर्ष निकालते हुए कि सुकरात “नश्वर” घेरे के भीतर है।)
– यदि निष्कर्ष ओवरलैपिंग क्षेत्र में आता है तो एक वैध सिलेओलिज्म की पुष्टि की जा सकती है।
वैधता स्थापित करने के लिए एकाधिक उपयोग:
1. सशर्त कथनों का परीक्षण:
– वेन आरेख का उपयोग पूर्ववृत्त और परिणाम के बीच संबंधों का प्रतिनिधित्व करके सशर्त बयानों की वैधता का परीक्षण करने के लिए किया जा सकता है।
– उदाहरण:
– अगर बारिश हो रही है तो जमीन गीली है.
– वेन आरेख प्रतिनिधित्व: एक वृत्त “बारिश हो रही है” के लिए और दूसरा “जमीन गीली” के लिए। ओवरलैपिंग क्षेत्र ऐसे उदाहरणों का प्रतिनिधित्व करता है जब दोनों स्थितियाँ सत्य हैं।
– यदि ओवरलैपिंग क्षेत्र वास्तविक दुनिया की स्थितियों से मेल खाता है तो वैधता की पुष्टि की जाती है।
2. तर्क संरचना का विश्लेषण:
– वेन आरेख कई स्थितियों या परिसरों से जुड़े जटिल तर्कों की संरचना का विश्लेषण करने में मदद कर सकते हैं।
– उदाहरण:
– यदि X, तो Y. यदि Y, तो Z. इसलिए, यदि X, तो Z.
– वेन आरेख प्रतिनिधित्व: ओवरलैपिंग क्षेत्रों के साथ एक्स, वाई और जेड के लिए सर्कल। आरेख स्पष्ट रूप से तर्क की तार्किक प्रगति की पुष्टि करता है।
3. समावेशी और विशिष्ट संबंधों का मूल्यांकन:
– वेन आरेख समावेशी और अनन्य संबंधों सहित सेटों के बीच संबंधों को चित्रित कर सकते हैं।
– उदाहरण:
– सभी A, B हैं। कुछ B, C नहीं हैं। इसलिए, कुछ A, C नहीं हैं।
– वेन आरेख प्रतिनिधित्व: ओवरलैपिंग और गैर-ओवरलैपिंग क्षेत्रों के साथ ए, बी और सी के लिए तीन सर्कल। आरेख स्पष्ट रूप से तर्क की वैधता का समर्थन करता है।
4. क्वांटिफ़ायर कथनों का सत्यापन:
– वेन आरेख सार्वभौमिक या अस्तित्वगत परिमाणकों से जुड़े बयानों को सत्यापित करने में सहायता कर सकते हैं।
– उदाहरण:
– सभी कुत्ते भौंकते हैं। कुछ कुत्ते मिलनसार होते हैं.
– वेन आरेख प्रतिनिधित्व: ओवरलैपिंग क्षेत्रों के साथ “छाल” और “मैत्रीपूर्ण” के लिए मंडलियां। आरेख स्पष्ट रूप से कथनों की वैधता का समर्थन करता है।
वेन आरेखों का उपयोग करने के लिए युक्तियाँ:
– सेट और रिश्तों को स्पष्ट रूप से परिभाषित करें:
भ्रम से बचने के लिए मंडलियों और उनके बीच संबंधों को स्पष्ट रूप से लेबल करें।
– निरंतरता सुनिश्चित करें:
सुनिश्चित करें कि आरेख में दर्शाए गए तत्व कथनों या परिसरों के अनुरूप हैं।
– वैधता की जांच करें:
पुष्टि करें कि वैधता स्थापित करने के लिए दृश्य प्रतिनिधित्व तर्क की तार्किक संरचना के साथ संरेखित है।
वेन आरेख बहुमुखी उपकरण हैं जो विभिन्न प्रकार के तर्कों की समझ और मूल्यांकन को बढ़ा सकते हैं, जटिल संबंधों को अधिक सुलभ बना सकते हैं और आलोचनात्मक सोच को सुविधाजनक बना सकते हैं।
Venn diagram: Simple and multiple use for establishing validity of arguments
Venn diagrams are graphical representations of sets and the relationships between them. They consist of overlapping circles that represent different sets, and the overlap illustrates the elements that are common to those sets. Venn diagrams are useful tools for visually organizing information and can be employed in various ways to establish the validity of arguments.

Simple Use for Establishing Validity:
1. Categorical Syllogisms:
– Venn diagrams are often used to assess the validity of categorical syllogisms. Each circle represents a category, and the overlap represents the common elements.
– Example:
– All humans are mortal. (Represented by a circle for “humans” inside a circle for “mortal.”)
– Socrates is a human. (Overlapping with the “humans” circle.)
– Therefore, Socrates is mortal. (Concluding that Socrates is within the “mortal” circle.)
– A valid syllogism can be visually confirmed if the conclusion falls within the overlapping region.
1.4.2 शिक्षक केंद्रित शिक्षण विधियां
Multiple Use for Establishing Validity:
1. Testing Conditional Statements:
– Venn diagrams can be used to test the validity of conditional statements by representing the relationships between antecedents and consequents.
– Example:
– If it is raining, then the ground is wet.
– Venn diagram representation: One circle for “raining” and another for “ground wet.” The overlapping area represents instances when both conditions are true.
– Validity is confirmed if the overlapping area corresponds to real-world situations.
2. Analyzing Argument Structure:
– Venn diagrams can help analyze the structure of complex arguments involving multiple conditions or premises.
– Example:
– If X, then Y. If Y, then Z. Therefore, if X, then Z.
– Venn diagram representation: Circles for X, Y, and Z with overlapping areas. The diagram visually confirms the logical progression of the argument.
3. Evaluating Inclusive and Exclusive Relationships:
– Venn diagrams can illustrate relationships between sets, including inclusive and exclusive relationships.
– Example:
– All A is B. Some B is not C. Therefore, some A is not C.
– Venn diagram representation: Three circles for A, B, and C with overlapping and non-overlapping areas. The diagram visually supports the argument’s validity.
4. Verifying Quantifier Statements:
– Venn diagrams can assist in verifying statements involving universal or existential quantifiers.
– Example:
– All dogs bark. Some dogs are friendly.
– Venn diagram representation: Circles for “bark” and “friendly” with overlapping areas. The diagram visually supports the validity of the statements.
शिक्षक केंद्रित व अधिगमकर्ता केंद्रित विधियों की तुलना–
Tips for Using Venn Diagrams:
– Clearly Define Sets and Relationships:
Clearly label the circles and relationships between them to avoid confusion.
– Ensure Consistency:
Ensure that the elements represented in the diagram are consistent with the statements or premises.
– Check for Validity:
Confirm that the visual representation aligns with the logical structure of the argument to establish validity.
Venn diagrams are versatile tools that can enhance the understanding and evaluation of various types of arguments, making complex relationships more accessible and facilitating critical thinking.
1.3 शिक्षण को प्रभावित करने वाले कारक