24-09-2020-Shift-01
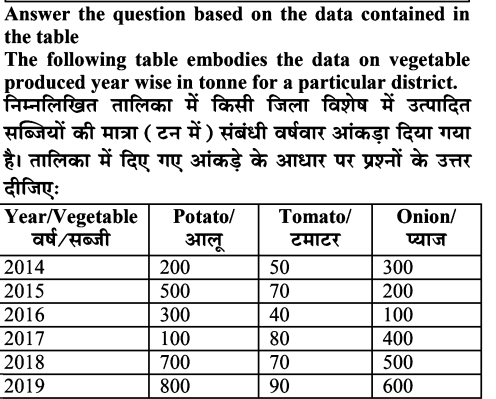
31. In which year(s) the production of potato is less than that of average production?
किस वर्ष किन वर्षों में आलू का उत्पादन उसके औसत उत्पादन से कम रहा?
1. 2016
2. 2014
3. 2015
4. 2017
Choose the correct answer from the options given below:
सही विकल्प चुनिएः
(a) 1 and 2 only / केवल 1 और 2
(b) 1, 2 and 4 only / केवल 1, 2 और 4
(c) 3 only / केवल 3
(d) 3 and 4 only / केवल 3 और 4
Ans. (b) : आलू का कुल उत्पादन 200 + 500 + 300 + 100 + 700 + 800 ⇒2600
आलू का औसत उत्पादन 2600 6 433.33 अतः वर्ष 2014, 2016 और 2017 मे आलू का उत्पादन औसत उत्पादन से कम रहा ।
32. In which year(s) is the production of tomato is the least? किस वर्ष टमाटर का उत्पादन सबसे कम है?
(a) 2014. (c) 2019
(b) 2017 (d) 2016
Ans. (d) : वर्ष 2016 में टमाटर का उत्पादन सबसे कम है।
33. What is the gross production of vegetables in the year 2018? वर्ष 2018 में सब्जियों का सकल उत्पादन कितना है?
(a) 1270
(b) 1275
(c) 1260
(d) 1280
Ans. (a) : वर्ष 2018 में सब्जियों का सकल उत्पादन
700+ 70 +500 = 1270
34. What is the increase (in percentage) of the total production of vegetable as compared to the year 2018 to 2019?
वर्ष 2018 की अपेक्षा वर्ष 2019 में सब्जियों के कुल उत्पादन में कितने प्रतिशत की वृद्धि हुई?
(a) 15.7%
(b) 16.1%
(c) 19.4%
(d) 17.2%
Ans. (d) वर्ष 2018 में सब्जियों का : कुल उत्पादन 700 + 70 + 500
⇒ 1270 वर्ष 2019 में सब्जियों का
कुल उत्पादन 800 + 90 + 600 1490 ⇒220 220
वृद्धि 14901270
वृद्धि प्रतिशत x 100 1270
⇒ 17.32%
35. In which year the productivity of vegetable is the maximum ? किस वर्ष में सब्जी की उत्पादकता सर्वाधिक है?
(a) 2018 (c) 2019
(b) 2016. (d) 2017
Ans. (c) :